Sunday 24 May 2020

Trade idea - NOK fx


a)  NOK collapsed in Mar for several reasons :

1 - it’s perceived as a risk-on currency in what became an extreme risk-off environment (the traditional reason for collapses in Scandi FX);
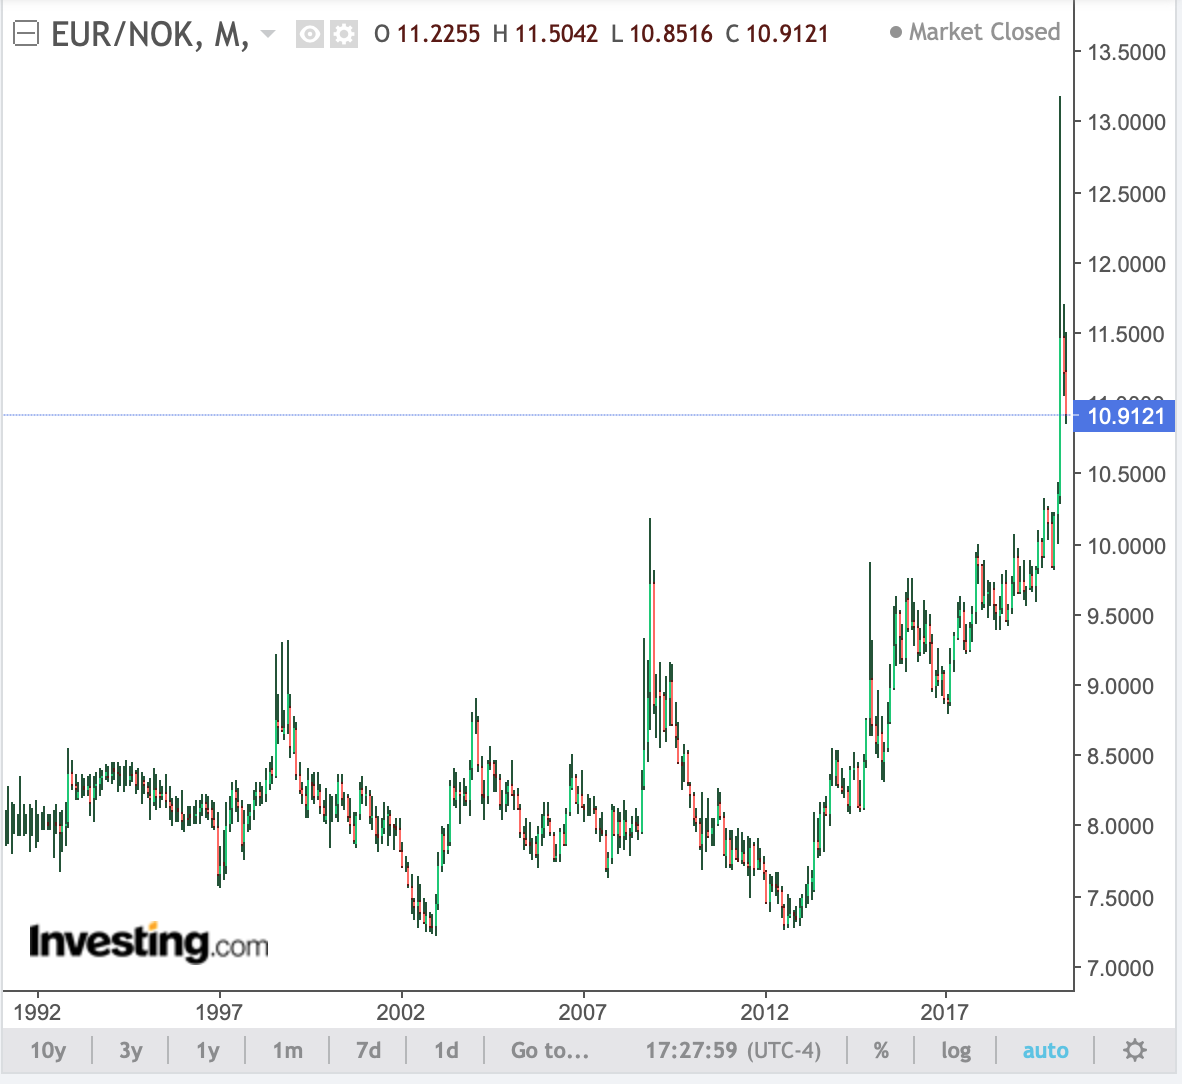
2 - oil stocks were the epicentre of the equity sell off, as OPEC reinforced the effects of coronavirus. Offshore investors liquidated Norwegian oil stocks, and those that were unhedged on FX sold the proceeds from NOK into their home currencies. In the prevailing risk-off environment the FX sale helped to generate an extreme overshoot in the currency, breaking every historical level from the last 30 years.
3 - NOK has looked "cheap" for quite a while. I'd guess (it is a guess) that leveraged money was slightly long NOK  at the start of the year, and was stopped out by the coronavirus selloff, adding to the selling pressure.


We got to 12 on USDNOK and 13 on EURNOK. Here are the long term charts :


b)  Like everyone, Norway has now cut rates to zero, and opened the fiscal taps. Unlike other Western economies, they don't need MMT ("open-ended QE" as the central banks prefer to call it) to finance the spending. The Oil Fund holds NOK10trn ($1trn) of offshore assets, and the rules allows them to tap this to fund the extra spending. While everyone else is debasing their currency with MMT/QE, Norway is selling offshore assets and repatriating the funds, generating a bid for NOK in the process. Same disease, entirely different symptoms. 

How big is this flow ? The budget deficit was NOK230bn last year, and looks likely to be NOK450-500bn this year. Ordinarily the government can use the Oil Fund's income (dividends and coupons) to finance the budget deficit, but in emergencies it can draw down the capital. This is the first time this has ever happened, and since the dividend yield on the equity portfolio has dropped, the capital drawdown will be significant. The relevant point for the FX market though is that the entire budget contribution from the Oil Fund has to be sold from foreign currencies into NOK. It looks likely to be NOK250-300bn higher than in previous years. 

c)  Norges Bank's governor, Mr Olsen, has said that they prefer not to cut from here ("We do not envisage making further policy rate cuts"), so a second wave or a further downturn in the economy should put all the burden on further fiscal easing. Although NOK will probably weaken on the headlines of any further stress, flows and fundamentals now point in the other direction. Liquidation of Oil Fund assets should turn NOK into a harder currency, in contrast to almost every other currency in the world. Further rate cuts are unlikely, and the distressed equity sellers have mostly been shaken out in March (in my opinion), so I'd argue that downside risks for NOK have fallen. For good measure, Norges Bank started making noises about intervention when NOK hit its lows in March. They don't want to see it there, and they have the firepower to back it up.

So there are 3 important points :
- NOK has been driven to 30 year lows by panic liquidation;
- drawdowns from the Oil Fund should strengthen the currency, unlike every other Western currency I know of;
- the potential downside risks for NOK (rate cuts and equity liquidation) seem much reduced, and further stress should see even more repatriation of Oil Fund assets into NOK.


To reduce p&l volatility and make the position more resilient (ie less risk-on) you could sell SEK and GBP against NOK.The Riksbank and Bank of England are both addicted to further QE, and in GBP’s case there's the risk of a harder Brexit (very real, in my opinion). Die-hard eurosceptics could sell EURNOK, hoping for a the “inevitable” eurozone breakup, and US election junkies can use USDNOK. Here are charts for GBPNOK and NOKSEK anyway :


Thoughts and opinions welcome.

Tuesday 17 June 2014

Abenomics, Act 2 ?

It seems to me there have been several important developments in Japan in the last few weeks, and in the best traditions of market fatigue and revulsion with a trade that hasn't given people an easy ride for months, they've slipped under the radar. For a start, the markets have lost interest, and what news coverage there is now focusses on investors' disillusionment with Abenomics. Positioning is *much* lighter, and the Nikkei in particular has underperformed this year. 

However :

1. The BoJ is still running the biggest QE programme relative to GDP anywhere, ever. Ok, except for Zimbabwe and the Weimar Republic. It dwarfs the efforts of the Fed and BoE. As inflation picks up real rates are becoming even more negative, so there's a positive feedback of easier financial conditions.

2. The Govt is considering cutting pension payouts by 0.9% annually, regardless of inflation and wages [http://www.bloomberg.com/news/2014-06-17/japan-mulls-de-linking-pensions-from-prices-to-allow-payout-cuts.html]. This is dynamite. First, look at the impact on pension costs : after a decade of this policy they fall by about a tenth in nominal terms, but by OVER A QUARTER IN REAL TERMS - if we can maintain 2% cpi. That does a lot to fix Japan's structural deficit. Second, and arguably more important, is the effect on a typical wealthy Japanese pensioner. They'll face a steady erosion of their state pension income in a "high" inflation environment. What would you do ? They have tons of cash, but deposit accounts now have a negative real return. Unless they want fx risk (and if they do it will boost usdjpy), they have almost no choice but to buy domestic high dividend stocks. 

3. The new Nikkei 400 index futures start trading in November. It's a given that GPIF will benchmark themselves to this index (it's comprised of companies selected for mkt cap, profitability and return on equity). Yucho, Kampo and many private sector funds will follow where GPIF leads. Another tailwind for low p/e, high dividend stocks. Companies are already reacting to get included in the index - e.g. Amada (6113 JP Equity) is up 50% since it announced it will distribute its entire retained earnings in dividends and buybacks solely in order to qualify for inclusion [http://www.bloomberg.com/news/2014-06-10/japan-stock-index-reject-seeks-inclusion-with-100-payout.html]. 

4. The Govt is clearly going to do something to cut corporation tax, most likely from 35% to around 25% over several years. They're still arguing about how to fund it, but assuming they sort that out then it would boost the value of a taxpaying company by 75/65 = 15%. Not such good news for firms sitting on huge deferred tax assets (there's an equity long short trade there), but it's another positive for cheap, low p/e firms. 

5. The NISA account tax breaks have already encouraged private individuals to buy equities, and the Govt is considering whether to double the limits for these accounts. Another incentive for pensioners to buy high dividend shares.

To summarise, the transmission of monetary stimulus (1.) is now being helped by financial reforms (3. and 5.), just as the Third Arrow of structural reforms start to kick in (2. and 4.). Also the spectre of the consumption tax rise has lifted - the world didn't end after all. It looks as though Abenomics is going to start generating some proper traction, at the same time that the street has lightened up enormously on its positioning. The high dividend low p/e stocks are the sweet spot, e.g. banks and trading companies, where P/Es of 6 and dividend yields of 3-4% are available. That seems irresistible/unavoidable for Japanese retail and institutional money. 
We've trodden water for over a year on this now. That's another box ticked for the rally to resume.

The main risk I see is a global equity selloff, especially if the Fed turn out to be behind the curve as the unemployment and inflation numbers are now suggesting. The obvious hedge is either to short US equities or to be short red EDs, but this post is long enough already. I've done both.

Friday 28 March 2014

Jan update

A couple of months overdue, but here it is.

January wasn't fun - I got caught with the herd, and compounded the mistake by being slow to reduce my positions. That's a bigger risk when your conviction in an idea gets higher, which was the case for me this month. I lost 14.1%, basically in fixed income, just under half of my capital at risk. The details looked like this :


monthly indexed NAV
return
100.00
Nov-12 17.8% 117.77
Dec-12 37.4% 161.78
Jan-13 38.1% 223.40
Feb-13 -3.3% 215.92
Mar-13 12.4% 242.62
Apr-13 30.2% 315.81
May-13 68.8% 533.08
Jun-13 36.9% 729.55
Jul-13 -12.6% 637.46
Aug-13 -1.7% 626.31
Sep-13 -9.6% 566.31
Oct-13 -4.9% 538.62
Nov-13 11.5% 600.41
Dec-13 15.9% 696.10
Jan-14 -14.1% 597.88

By asset class :

Equities            +4.7%          running a short in spx paid off, outweighing losses in Nikkei
Commodities   +0.7%          short copper
Fixed income   -5.7%           short JGBs
                         -5.9%           short M6 and Z7 Eurodollars against Aussie Z4 bills
                         -6.3%           short gilts and 10y notes
FX                    -1.6%           from xJPY and short AUDUSD

Where I went wrong : too slow to cut, and being too aggressive into payrolls (to be fair, most of the indicators were suggesting a robust number, e.g. ADP). On the bright side, the awful start to 2014 has hit just about all the macro traders, so positions will have been reduced. The general direction of rates seems very clear (the Fed has no idea where NAIRU is, and in anything other than a best case scenario is behind the curve), so I suppose we have to clear out most of the positions before we can make any progress higher in yields.


Monday 6 January 2014

Dec update


      indexed    
       NAV
monthly return
100.00
Nov-12 17.8% 117.77
Dec-12 37.4% 161.78
Jan-13 38.1% 223.40
Feb-13 -3.3% 215.92
Mar-13 12.4% 242.62
Apr-13 30.2% 315.81
May-13 68.8% 533.08
Jun-13 36.9% 729.55
Jul-13 -12.6% 637.46
Aug-13 -1.7% 626.31
Sep-13 -9.6% 566.31
Oct-13 -4.9% 538.62
Nov-13 11.5% 600.41
Dec-13 15.9% 695.74

Equities           +1.4%       Japanese equity sectors (megabanks, trading companies)
                        -4.6%        Shorts in S&Ps
Commodities  +0.9%       Short gold
Fxd income     +4.1%       Short JGBs
                        +5.9%       Short EDZ7 and TYH4 against Aussie Z4 bills
FX                   +8.1%      About 5% from long USDJPY and GBPJPY positions and the rest from            
                                          short AUDUSD and AUDNZD

Overall a good month. I was heavily overweight in risk-on trades (short US and Japanese fxd income, long X-JPY and long Nikkei), partially offset by a significant short in US equities and a long in Aussie fxd income which should have been larger. As of today I'm out of USDJPY, and I've increased the SPX short further (having been stopped on it twice already), so I'm now much more balanced. The easiest trade of the month was definitely shorting Treasuries for a 3% target once the taper was announced.

Looking ahead, I think we're treading water until payrolls (statement of the obvious, I know). I'd expect a healthy number : small businesses are hiring if Gallup etc are to be believed, and the ISM employment indices say the same for larger firms. It's backed up by jobless claims and consumer confidence, so 200k plus is possible for payrolls, unless ADP prints a shocker on Wed. The outlook for Q1 seems to be for more of the same, so we could get a significant move lower in fixed income after cleaning out some positions. Could we approach 6.5% unemployment by the end of Q1 ? The slow bear flattening of the TIPS 5/10 break-even curve is interesting, especially as gasoline has been fairly stable. It suggests deflation fears are overblown, and as I've mentioned before, I think that higher inflation is the only missing piece of the puzzle for a serious bear market in rates. We're not there yet, but I'm watching this closely. I'm taking this rally in fixed income as an opportunity to buy puts structures on short green eurodollars which have great risk/reward if the selloff resumes.

The pieces are also falling into place in Australia. The PMIs are turning lower after a post-election bounce, consumer confidence is taking a hit (gas prices perhaps ?) and there are indications of a slowdown in China again. Despite all this, AUSUSD has rallied since New Year and is now near the middle of Glenn Stevens' 0.85/0.95 range. The biggest moves have been on risk reduction days, despite AUDUSD's usual risk-on behaviour, so I'm putting the rally down to a New Year squeeze. The key level is 0.8850, which has supported AUDUSD since last June. If that level fails to hold it can go to 0.82 I think.


Monday 30 December 2013

year-end opportunities in eurusd and Japan

Right now I'm quite short fixed income in the US and Japan - what you'd have called a risk-on position a year ago - and so selling eurusd looks like a good offsetting trade. We're just reaching a nice 5 year trend line, so it's possible to set quite a tight stop on the upside :


The situation in Turkey is a potential catalyst for a selloff in eurusd (you can imagine contagion into the Euro if things get out of control). There seems to be some end-of-year selling of dollars at the moment, and from a medium term perspective the economic strength is definitely clearer in the US than in the eurozone, so this looks like a good entry point for several reasons. Anyway, I'm selling it around here with a stop not too far above that trend line. We'll see if it holds. 

In Japan I'm switching from short yen to long Nikkei / short JGBs. I've just taken profit on some usdjpy as the trade now looks crowded and possibly overbought in the short term. I prefer owning high dividend Nikkei stocks. The trading companies are absurdly cheap (Marubeni, Mitsui and Sumitomo have forward p/es around 6.5 and dividend yields of 3.5%) and the megabanks aren't much more expensive. I'm reminded of the situation in the UK 3 years ago : retail investors bought boring, high dividend, low p/e stocks in their ISAs (tax free wrapper accounts) when they realised rates wouldn't rise for years and high inflation would penalise cash deposits. NISAs are the Japanese equivalent and have just started trading. If I was a Japanese pensioner sitting on a lot of cash and worried by rising inflation I'd want the safest, most boring high income stocks I could think of, preferably names I'd known for years, all held in a tax free account. Buying the trading companies in a NISA fits the bill perfectly. They've been outperforming the index recently, as you'd expect as the NISA deadline approaches. 

JGBs have no obvious reason to sell off since the BoJ keeps buying, but the chart looks terrible. The banks have been buying put options, which says a lot (the "stupid gaijin" trade), and everyone is talking about the BoJ increasing their purchases sometime next year, so that risk is partly in the price already. It certainly isn't yet a widely held position, and I think we could trade another 10-15bps higher quite easily. 

Wednesday 18 December 2013

Fed to market : If you think we screwed up last time, just watch this...

It's interesting to compare the situation now with 2003/2004. If the drop in unemployment persists as it has for the last 3 years, we'll reach 6.3%, the level of peak unemployment in the dot com recession, around the end of next year :


How should eurodollars be priced if the Fed subsequently reacts exactly as it did last time ? Well, they made their final cut to 1% in Jun03 as unemployment peaked, kept rates on hold for a year and then hiked in a straight line by 425bps over the following 2 years. Like this :


Matching the two dates of identical 6.3% unemployment suggests rates stay at 0.25% till Jan16, then rise to 4.5% by Jan18. Allowing 30bp for the funds/Libor spread, that gives 95.20 (4.8%) for Dec17 euros. EDZ7 currently trades at 96.80, ie 160bps too high (interestingly that's exactly where I'd expect the next selloff in EDZ7 to stop from a technical perspective : down 200bps from 98.10 to 96.15 over last summer, a 100bp bounce to 97.15 this autumn and then another 200bps getting you to 95.20-ish. Funny coincidence.).

Of course, there are some differences :
- Fed Funds are 75bp lower now than in 2003 : easier policy now
- the Fed is saying they'll keep rates low for longer than Jan 2016 : easier policy
- the Fed has ~$4trn of bonds on its balance sheet : easier policy
- the stock market is at an all time high instead of recovering from a crash : easier financial conditions
- GT10 is 3% instead of 5% : easier financial conditions

One thing that isn't very different is inflation. Here's core cpi :


Inflation is actually higher today than in 2003, so real rates are even easier than nominal rates. In fact current 10yr break-evens are almost identical now to their levels in 2003 as well.

Obviously the Fed made a colossal mistake in 2003-2007. They kept rates too low for too long and inflated a monumental bubble which nearly destroyed everyone when it burst. So how can the current forward guidance, committing them to even lower real rates for even longer, be credible ? It all comes down to inflation I think. If the core cpi numbers turn as they did in late 2003, then the Fed will start hiking rates soon. Within a few weeks everyone will be dusting off charts like these and drawing the obvious conclusion that the steady-as-she-goes sequence of rate hikes from 2004-2006 is a better-than-best case scenario, and that to prevent the risk of bubbles they really ought to tighten even faster. Which all points to EDZ7 and its friends being 200bps or more lower than they are now. 95.20 on EDZ7 strikes me as a best-case scenario.

Personally I think there's a significant chance of this realisation dawning on the market in Q1, as we post stellar growth numbers and everyone races to upgrade their forecasts against the backdrop of tapering. Low delta puts on the golds are the obvious risk/return trade. Ideally equities will fail again here at 1810 on spx, giving a risk-off trade with a great risk/return to set against the rates trade. The combination could be the trade of the year if it lines up.


Monday 9 December 2013

Nov update


indexed NAV
adjusted return
100.00
Nov-12 17.8% 117.77
Dec-12 37.4% 161.78
Jan-13 38.1% 223.40
Feb-13 -3.3% 215.92
Mar-13 12.4% 242.62
Apr-13 30.2% 315.81
May-13 68.8% 533.08
Jun-13 36.9% 729.55
Jul-13 -12.6% 637.46
Aug-13 -1.7% 626.31
Sep-13 -9.6% 566.31
Oct-13 -4.9% 538.62
Nov-13 11.5% 600.41

Having drawn down from Jul to Oct (my own fault in Jul and Oct, and also due to the Fed's disgraceful behaviour in Sept) I was uncomfortably close to my stop by the end of Oct. I'm running a 30% drawdown from peak month end NAV, so I was 3.8% away at the end of Oct and running correspondingly smaller positions than in Jun. After Nov I'm back in the clear, so I can trade more freely without being constrained by the proximity of the stop. The easiest market has been fx, as the market looked into Q1 and saw a tighter Fed and a BoJ which is likely to undertake another round of easing :

Equities            2.7%        Nikkei longs (aka USDJPY) worked, offset by a small loss from long VIX
Commodities   0.4%        Short gold again, having been stopped on the same trade in Oct
Fxd income      0.0%        Gains in Aussie bills and short TYZ3 offset by losses from short JGBs
FX                    8.4%        Long USDJPY, GBPCHF and short AUDUSD and AUDNZD all worked

I should have made more in equities really : after payrolls it was clear that the hedge fund community needed to reduce the performance gap with equities to avoid some difficult investor conversations. The problem is that the taper is coming though. Never mind the data - the guard is changing at the Fed and QE is Bernanke's pet, not Yellen's. She's more interested in optimal control and convincing the market that rates will stay low for another 3 or 4 years. Anyway, QE's days seem numbered, and even if you believe that this year's equity rally - powered by  multiple expansion - has nothing to do with QE (I don't) then you don't want to find out the hard way that you might be wrong. After a great year, and with a major change in the monetary landscape coming, common sense suggests reducing equity positions. So being long stocks feels to me like picking up the last few pennies in front of the steamroller : 2% of upside vs 10% of downside. Not very attractive, so I left the equity market in the US alone in Nov.

Current thoughts (in brief):
I'm now short equities, but concerned I'm too early. Vol has picked up, and the 1810 highs should be met with selling from some over-excited longs from a couple of weeks ago. Maybe that will cap the upside now. If not, I'll respect the rally and cut.

FX still seems the easiest market in my opinion. I'm short AUD, JPY and CHF against GBP, USD and NZD (small for the latter). My risk-off hedge is long Aussie Dec14 bill futures, as before. More and more people are starting to suggest a final cut in 2014, but even without this the position still works. What's clear is that the hurdle for  rate hikes is higher than people thought a few months ago. I think rates aren't rising for a couple of years at least and AUDUSD probably heads towards its 0.82 low from 2010.

Fixed income. I like being short JGBs, for the first time in ages : real yields are negative in Japan and positive in the US, and the gap is the widest since 1998. That's triggered the second largest flows into Treasuries from Japan since they started collecting the data in 2000 - in other words, Japanese institutions are voting on JGBs with their feet. Everyone believes Abenomics will stutter in the spring and require more bond buying from the BoJ, so it only takes a few signs of durable success to make them question that assumption. That would push JGB yields a lot higher (ok, 15-20bps higher anyway). The negative carry isn't so bad, and positioning seems quite clean. Everyone's afraid to fight the BoJ, but there's always a level where it's the right idea.
Elsewhere I'm running a medium sized short in TYH4, as yields seem set to drift just north of 3% with a Jan taper. To an extent it's the same as the JGB trade though.